Visualization is daydreaming with a purpose ~ Bo Bennett
R is good at one thing, analysis. Until now it was sufficient on its own, with its library base, but now the need have changed. We want interactive visualization and JavaScript is ahead in the race. Thanks to this man, Ramnath Vaidya, who created a wonderful library called rCharts that brings JavaScript’s graphics into R. As you are reading this you must be familiar with plot and ggplot in R. So let’s explore rCharts without delay.
rCharts supports multiple JavaScript charting libraries:
-
[NVD3] (http://timelyportfolio.github.io/docs/_build/html/intro/create.html#nvd3)
- Most Interactive
- Multiple layers do not work
-
[Highcharts (Free for non-comercial use)] (http://timelyportfolio.github.io/docs/_build/html/intro/create.html#highcharts)
- Better than below
- Supports multiple layers/series
-
[Morris] (http://timelyportfolio.github.io/docs/_build/html/intro/create.html#morris)
-
[Rickshaw] (http://timelyportfolio.github.io/docs/_build/html/intro/create.html#rickshaw)
-
[xCharts] (http://timelyportfolio.github.io/docs/_build/html/intro/create.html#xcharts)
You can click on any of them to go to their respective examples. They all have their pros and cons. I would suggest you to use NVD3 if you are interested in a graph that has just one type of element eg: Scatter Plot, Line, Bar, etc. These are the only library which currently support layering.
Below I’ll give code and output for using Highcharts and NVD3. Dimple was just updated as I am writing this blog, I’ll try to write a separate blog on that.
Prerequisite
Install rCharts. This requires devtools to be installed.
require(devtools)
install_github('rCharts', 'ramnathv')
NVD3
We will our mtcars data set in all below examples to keep it simple. Visit NVD3 documentation for more example, have a look below and you will understand how they work.
library("rCharts")
#NVD3 is nPlot()

a <- nPlot(
	mpg ~ wt,                             # y vs x
	data = mtcars,			      # data set
	group = "cyl",			      # group by
	type = "scatterChart")                # type of chart
					      # eg:multiBarChart, lineChart, pieChart

   a$xAxis(axisLabel = "Weight")
   a$yAxis(axisLabel = "MPG")

   a$chart(color = c(
   		'brown',
   		'black',
	      '#FFAFA'))		       # override default colors

a			               # prints the graph
a$save("E:\\temp.html")	               # save it as html
Output:

See Interactive Ouput on Github Here
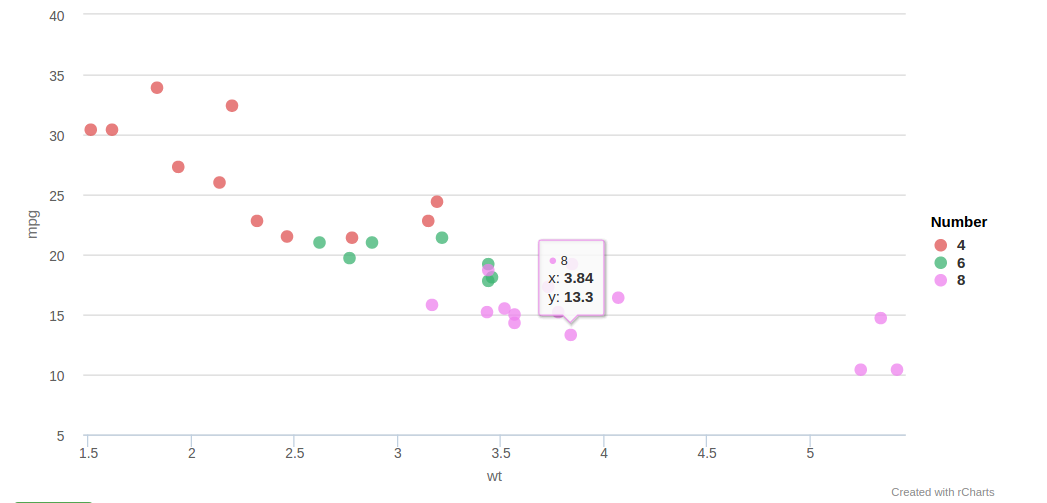
Highcharts
The example below creates a scatter plot with mtcars. I have tried to use almost all the functions and parameters. If I have missed some, please point it out in the comments below.
library("rCharts")
#Highcharts is hPlot()

a <- hPlot(
	x = "wt",				#x axis value
	y = "mpg",				#y axis value
	data = mtcars,			        #dataset
	type = "scatter",		        #type: line, bubble,..
	group = "cyl",		                #group by
	#size = "cyl",			        #can adjust size of bubble etc
	radius = 5)				#size of points

a$title("This is a Title")
a$subtitle("This is a subtitle")
a$credits(text = "Created with rCharts", href = "rCharts")

a$legend(					#use this to modify legend
  title = list(
     text = "Number"),		                #adds a title to legend
     align = 'right', 			        #default is at bottom
     verticalAlign = 'middle',
     layout = 'vertical')

a$plotOptions(				        #Display all groups as circle
  scatter = list(marker = list(symbol = 'circle')))

a$colors(					#add custom colors
  'rgba(223, 83, 83, .75)',
  'rgba(60, 179, 113, .75)',
  'rgba(238, 130, 238, .75)'
)

a					         #prints the graph
a$save("E:\\temp.html")		                 #saves to html
#More complex graphs in next blog!
Output:
 See Interactive Ouput on Github Here
I hope you liked the blog and the examples proved useful. They have been taken from many different websites and StackExchange. Thank you everyone for reading.